The animation shows the expected global change of precipitation from 2000-2100. The data used for the animation is from IPCC's fifth assessment report. It includes 40 model simulations in accordance with emission pathway RCP 8,5. Animation: Asgeir Sorteberg.
Worst-case scenario
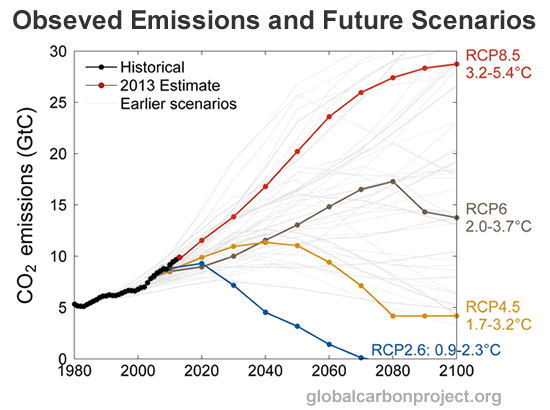
The videos depict the average of forty simulations from IPCC’s fifth assessment report, with deviations from the normal meteorological set period 1961-1990. The simulations follow the representative emission path way called RCP 8.5. That means that we follow an emission path of greenhouse gases that will provide a warming effect of 8.5 Watts per square meter. This can provide a global warming of four degrees by the end of the century, see figure below. The lowest emission curve is RCP 2.6 and gives a warming of just a degree compared to pre-industrial times, which is about where we are today.

The greenhouse gas emissions have long followed this worst-case scenario path. The global emissions figures for 2014 will be released on December 7th. It is The Global Carbon Project that annually collects and analyses emissions figures for the entire world. So far this year, the International Energy Agency (IEA) reports a flattening of the emission curve from 2013 to 2014.
Here is an animation of the actual warming of the earth from 1880 til today.
Difference between Polar Regions in north and south
Regarding the changes in temperature, it is numbers from land areas that show the large changes, while temperatures in the ocean will not change as much.
- This is partly linked to how the Arctic atmosphere is quite ineffective to get rid of energy to space, and that we are losing ice and snow. This increases the absorption of solar radiation and provides additional heating. We can also see a huge difference between the polar regions of the north and south. Since there is an accumulation of land north on our planet the temperature changes will be greatest here. It is more complicated in the south, here we have an additional effect of ozone which contribute to change the atmospheric circulation, Asgeir Sorteberg says.
Numerous effects make it hotter
Since the Arctic atmosphere is ineffective to get rid of energy simultaneously as the reduction of ice and snow reduces the earth's ability to reflect sunlight, the north experiences increased heating. This results in a decrease of the heat difference between the tropics and polar regions. Thus researchers expect less heat transfer to the north, which will contribute to curb the warming of the north. However, there are many other processes that can lead to warming of these areas, for example that more moisture is transported northwards.
- We expect greater moisture transport due to warming. When water vapour condenses and turns into droplets, heat is emitted - and we get a warming effect. This is part of the compensation for the reduced heat transport. The simple explanation - that the increased warming in the north is due to the reduced amount of snow and ice in the north, is far from the whole truth. The changes are the sum of a number of processes both on land, at sea and in the atmosphere, Sorteberg explains.
On the global scale, there is more rain. When it gets warmer on earth more water evaporates and this results in more rain. But the increased rainfall is not distributed evenly across the globe.
Scientists divide the earth in three sections: A tropical zone in a belt around the equator. A sub-tropical belt of desert areas, with Sahara / Sahel. The last zone includes the areas north and south of this belt, which also is wet.
- What happens when the earth gets warmer is that the subtropical zone moves slightly northward. Thus we get desert drought around the Mediterranean and in North America. South of the equator, in Brazil and South Africa, it becomes drier as well. However, it is not as simple as this everywhere. For example, in Australia and India, changes in the monsoon and the ocean-atmosphere phenomenon El Niño will also disrupt the bigger picture, Sorteberg says.

